|
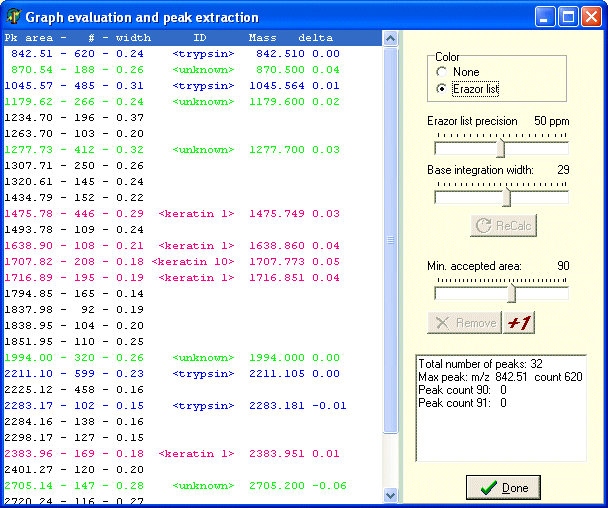
The left-hand list-box shows the result of the integration. The columns show from left to right:
Pk mass : The integrated mass value of the peak. If you work with monoisotopic masses, this value will also be monoisotopic (and average if you work with average mass values).
#: Area of the peak.
Width; The base width of the peak. If this value is high, you will have to check the graph to whether it is one or several merged peaks.
ID: Label of identification in the Erazor list - if present.
Mass: Mass value from the identified item in the Erazor list.
Delta: Deviation in dalton from the integrated value in the first column.
The list is managed by the controls in the right-hand panel, with the controls from top to bottom:
Color: If set to none, the list box is presented in black and white, if set to Erazor list, mass values that are found in the current Erazor list will be colored according to the color scheme defined.
Erazor list precision and Base integration width are parameters that can be used to fine-tune the peak integration.
Min. accepted area is the most important parameter, as the setting determines the threshold above which the peak is accepted into the left-hand list. When you make a change, the ‘Remove’ button becomes enabled, and when pressed, updates the list-box with the new threshold value.
The small right-hand list-box shows some statistics of the table.
|


