|
|
|
 |
|||||||||
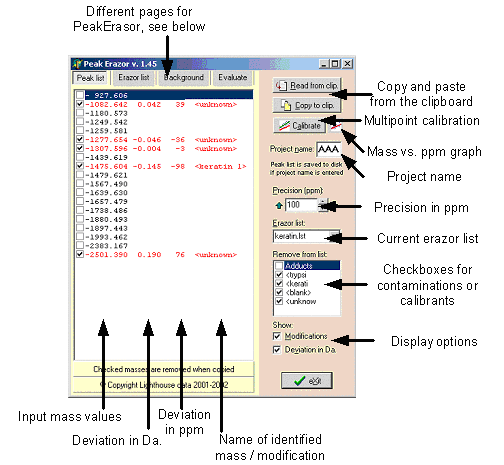
Program layoutPages:
Copy and paste: Use these buttons to paste and copy mass lists to and from the clipboard (’Read from clip’ – paste from clipboard – you may also use the keyboard shortcut ’Ctrl+V’; ’Copy to clip’ – copy to clipboard – you may also use the keyboard shortcut ’Ctrl+C’). Multipoint calibration: Calibrate the mass list based on known peaks (contaminants). Mass vs. ppm graph: Show/hide the graph showing accuracy of mass values identified as contaminants (e.g. part of the Erazor list). The size and position of the graph is saved between program executions. Precision (ppm): Enter the precision to limit the identification of contaminants. You can either enter directly from the keyboard or click on the up/down arrows. The arrow to the left of the field changes the precision to the maximum allowed and the right-hand arrow to the minimum level (set in setup, see below). ppm = part per million; 1000 ppm = 0.01%; Current Erazor list: If multiple Erazor lists have been saved, you can select alternative lists here (e.g. if you work with different mass spectrometers you can have a separate list for each). Checkbox list: A list of checkboxes to select different parts of the erazor list. Only checked items will be searched against the current mass list. The list shows the first 6 characters of the contaminant name. Display options: Select whether you will have the comparison show Modifications and/or Deviations in Da. The modifications are oxidation of methionine, multibasic residues and pyroglutamic acid. By un-checking ’Deviations in Da.’ your can narrow the display to take up less space. The mass list shows:
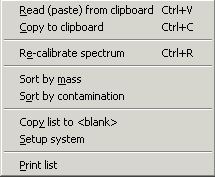
Pop-up menu: The pop-up menu is accessed by right-clicking in the mass list. Most of the commands are copies of buttons present in the program (see above). |
|||||||||
 |
|||||||||
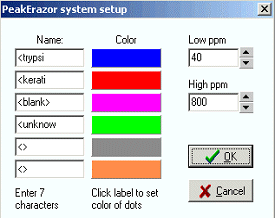
Pop-up menu commandsSort by mass/Sort by contamination: Sorts the mass list by either mass (default) or by the name of the contamination. Copy list to <blank>: The currently displayed mass list is copied to the <blank> part of the Erazor list. The previous <blank> part is deleted. For more details see below. Setup system: Setup a number of parameters. Each section in the checkbox list (see above), have its own color in the Mass vs. ppm graph. The sections are listed in the left-hand boxes (only the first 7 characters are significant (this means that several different keratins can be listed in the Erazor list, but shown in the same group as long as the first 7 characters are identical). The color of each section can be set by clicking on the colored label to the right of each edit box. The Low ppm and High ppm are the ppm values set by clicking on the up and down arrows by the Precision field. |
|||||||||
 |
|||||||||
|
Site last updated: February 14, 2025 |
|||||||||
