|
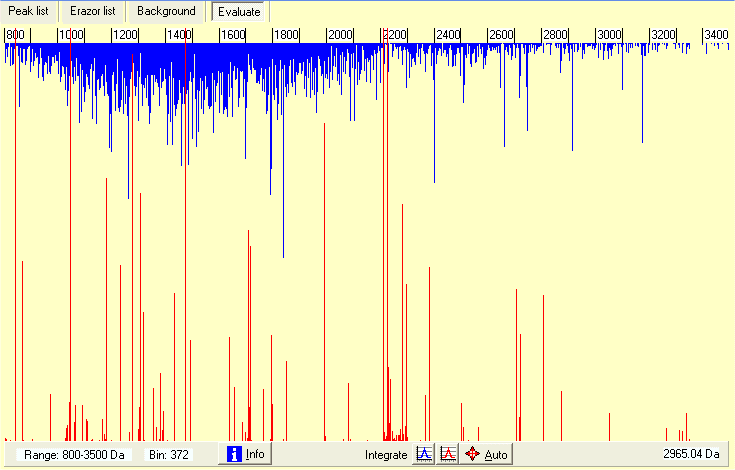
When you read a saved combined mass list it shows up as above. All mass values are combined into a synthetic mass spectrum with the height of the graph shows the number of mass values in the current bin. Blue lines (growing down) are the mass values accepted onto the clipboard, the red lines (growing up) are the mass values rejected from the clipboard (due to fit with mass values from the Erazor list.
The graph can be zoomed on the x-axis by left-click on either side of the wanted region to zoom in, you zoom out by double-click. The current range displayed is shown in the bottom left-hand corner. You zoom the y-axiz by the ‘magnify’ radio button on the right.
The right-hand list-box shows initially statistics on the file read (can be recalled at any time by clicking the white-on-blue ‘i’ button).
An immediate look at the graph above shows that some of the ‘blue’ peaks are extra-ordinarily large, e.g. the one just above 2400. If you zoom in on the ‘peak’ you can integrate the peak by click on the blue ‘Integrate’ buttom and click to the left and right of the peak. The result of the integration will be reported in the right-hand list-box - a total of 121 counts out of 843 spectra, strongly indicating that this is a contaminant peak (occurring one out 7 times). At the same time accurate mass of the ‘peak’ is calculated to 2104.27.
In a similar way the red ‘rejected’ peaks can be calculated and compared to the current Erazor list. For unknown mass values, you can thus improve the mass precision or, if the peak is low, you can remove seldomly found mass values - the longer the Erazor list the higher the chance of removing a ‘real’ peptide from the target protein.
All the peaks can be ‘integrated’ in a single operation by pressing the ‘Auto’ button. This will open an integration dialog that also enables you to save the values found in a new Erazor list.
|


